“Single subject research (also known as single case experiments) is popular in the fields of special education and counseling. This research design is useful when the researcher is attempting to change the behavior of an individual or a small group of individuals and wishes to document that change. Unlike true experiments where the researcher randomly assigns participants to a control and treatment group, in single subject research the participant serves as both the control and treatment group. The researcher uses line graphs to show the effects of a particular intervention or treatment. An important factor of single subject research is that only one variable is changed at a time. Single subject research designs are “weak when it comes to external validity….Studies involving single-subject designs that show a particular treatment to be effective in changing behavior must rely on replication–across individuals rather than groups–if such results are be found worthy of generalization” (Fraenkel & Wallen, 2006, p. 318).
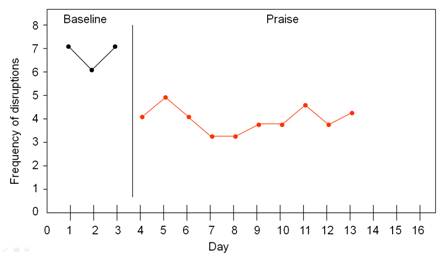
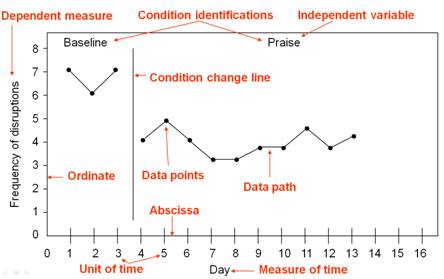
Suppose a researcher wished to investigate the effect of praise on reducing disruptive behavior over many days. First she would need to establish a baseline of how frequently the disruptions occurred. She would measure how many disruptions occurred each day for several days. In the example below, the target student was disruptive seven times on the first day, six times on the second day, and seven times on the third day. Note how the sequence of time is depicted on the x-axis (horizontal axis) and the dependent variable (outcome variable) is depicted on the y-axis (vertical axis).

Once a baseline of behavior has been established (when a consistent pattern emerges with at least three data points), the intervention begins. The researcher continues to plot the frequency of behavior while implementing the intervention of praise.
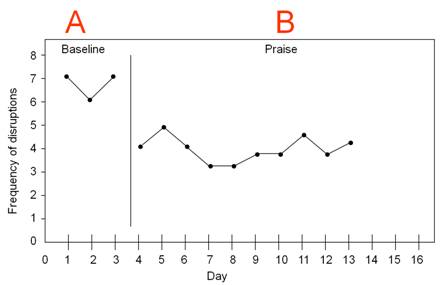
In this example, we can see that the frequency of disruptions decreased once praise began. The design in this example is known as an A-B design. The baseline period is referred to as A and the intervention period is identified as B.
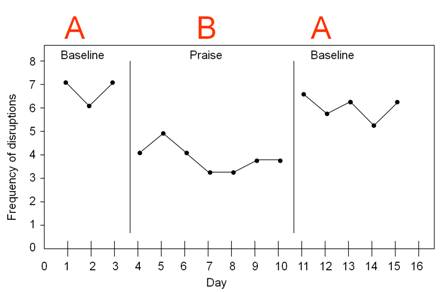
Another design is the A-B-A design. An A-B-A design (also known as a reversal design) involves discontinuing the intervention and returning to a nontreatment condition.
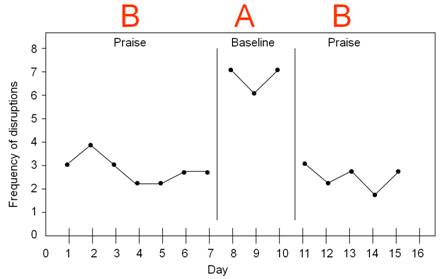
Sometimes an individual’s behavior is so severe that the researcher cannot wait to establish a baseline and must begin with an intervention. In this case, a B-A-B design is used. The intervention is implemented immediately (before establishing a baseline). This is followed by a measurement without the intervention and then a repeat of the intervention.
Multiple-Baseline Design
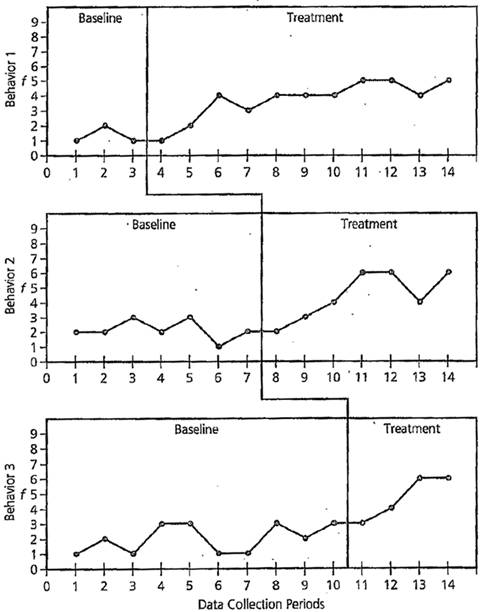
Sometimes, a researcher may be interested in addressing several issues for one student or a single issue for several students. In this case, a multiple-baseline design is used.
“In a multiple baseline across subjects design, the researcher introduces the intervention to different persons at different times. The significance of this is that if a behavior changes only after the intervention is presented, and this behavior change is seen successively in each subject’s data, the effects can more likely be credited to the intervention itself as opposed to other variables. Multiple-baseline designs do not require the intervention to be withdrawn. Instead, each subject’s own data are compared between intervention and nonintervention behaviors, resulting in each subject acting as his or her own control (Kazdin, 1982). An added benefit of this design, and all single-case designs, is the immediacy of the data. Instead of waiting until postintervention to take measures on the behavior, single-case research prescribes continuous data collection and visual monitoring of that data displayed graphically, allowing for immediate instructional decision-making. Students, therefore, do not linger in an intervention that is not working for them, making the graphic display of single-case research combined with differentiated instruction responsive to the needs of students.” (Geisler, Hessler, Gardner, & Lovelace, 2009)
Regardless of the research design, the line graphs used to illustrate the data contain a set of common elements.
Generally, in single subject research we count the number of times something occurs in a given time period and see if it occurs more or less often in that time period after implementing an intervention. For example, we might measure how many baskets someone makes while shooting for 2 minutes. We would repeat that at least three times to get our baseline. Next, we would test some intervention. We might play music while shooting, give encouragement while shooting, or video the person while shooting to see if our intervention influenced the number of shots made. After the 3 baseline measurements (3 sets of 2 minute shooting), we would measure several more times (sets of 2 minute shooting) after the intervention and plot the time points (number of baskets made in 2 minutes for each of the measured time points). This works well for behaviors that are distinct and can be counted.
Sometimes behaviors come and go over time (such as being off task in a classroom or not listening during a coaching session). The way we can record these is to select a period of time (say 5 minutes) and mark down every 10 seconds whether our participant is on task. We make a minimum of three sets of 5 minute observations for a baseline, implement an intervention, and then make more sets of 5 minute observations with the intervention in place. We use this method rather than counting how many times someone is off task because one could continually be off task and that would only be a count of 1 since the person was continually off task. Someone who might be off task twice for 15 second would be off task twice for a score of 2. However, the second person is certainly not off task twice as much as the first person. Therefore, recording whether the person is off task at 10-second intervals gives a more accurate picture. The person continually off task would have a score of 30 (off task at every second interval for 5 minutes) and the person off task twice for a short time would have a score of 2 (off task only during 2 of the 10 second interval measures.
I also have additional information about how to record single-subject research data.
I hope this helps you better understand single subject research.
I have created a PowerPoint on Single Subject Research, which also available below as a video.
I have also created instructions for creating single-subject research design graphs with Excel.
References
Fraenkel, J. R., & Wallen, N. E. (2006). How to design and evaluate research in education (6th ed.). Boston, MA: McGraw Hill.
Geisler, J. L., Hessler, T., Gardner, R., III, & Lovelace, T. S. (2009). Differentiated writing interventions for high-achieving urban African American elementary students. Journal of Advanced Academics, 20, 214–247.
Del Siegle, Ph.D.
University of Connecticut
del.siegle@uconn.edu
www.delsiegle.info
Revised 02/02/2024
![]()