Making Single-Subject Graphs with Spreadsheet Programs

In order to create a graph with broken graph lines, such as for a single subject A-B research design, you must stagger the baseline data and intervention data in two separate columns on your Excel spreadsheet before creating the graph.

The following directions are for Excel in Office 2013:

Single subject research graph

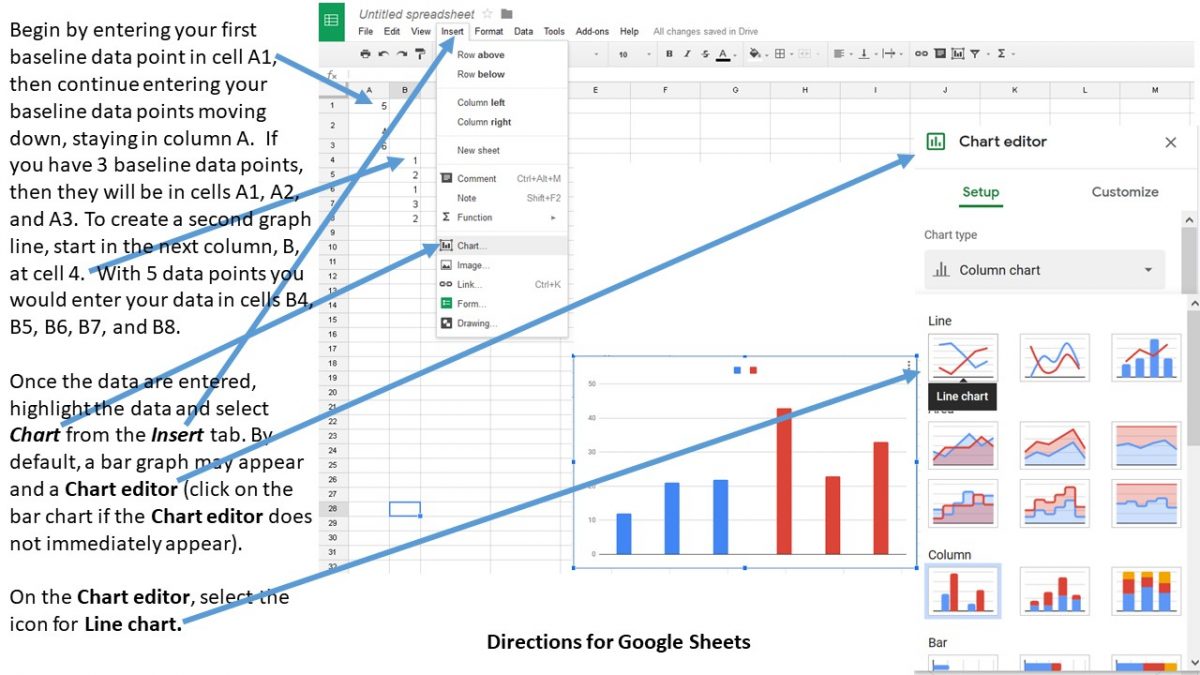
The following directions are for Google Sheets:

Begin by entering your first baseline data point in cell A1, then continue entering your baseline data points moving down, staying in column A.  If you have 3 baseline data points, then they will be in cells A1, A2, and A3. To create a second graph line, start in the next column, B, at cell 4.  With 5 data points you would enter your data in cells B4, B5, B6, B7, and B8.   Once the data are entered, highlight the data and select Chart from the Insert tab. By default, a bar graph may appear and a Chart editor (click on the bar chart if the Chart editor does not immediately appear).  On the Chart editor, select the icon for Line chart.

Del Siegle, Ph.D.

updated 6.19.2019