An introduction to statistics usually covers t tests, ANOVAs, and Chi-Square. For this course we will concentrate on t tests, although background information will be provided on ANOVAs and Chi-Square.
A PowerPoint presentation on t tests has been created for your use.
The t test is one type of inferential statistics. It is used to determine whether there is a significant difference between the means of two groups. With all inferential statistics, we assume the dependent variable fits a normal distribution. When we assume a normal distribution exists, we can identify the probability of a particular outcome. We specify the level of probability (alpha level, level of significance, p) we are willing to accept before we collect data (p < .05 is a common value that is used). After we collect data we calculate a test statistic with a formula. We compare our test statistic with a critical value found on a table to see if our results fall within the acceptable level of probability. Modern computer programs calculate the test statistic for us and also provide the exact probability of obtaining that test statistic with the number of subjects we have.
Student’s test (t test) Notes
When the difference between two population averages is being investigated, a t test is used. In other words, a t test is used when we wish to compare two means (the scores must be measured on an interval or ratio measurement scale). We would use a t test if we wished to compare the reading achievement of boys and girls. With a t test, we have one independent variable and one dependent variable. The independent variable (gender in this case) can only have two levels (male and female). The dependent variable would be reading achievement. If the independent had more than two levels, then we would use a one-way analysis of variance (ANOVA).
The test statistic that a t test produces is a t-value. Conceptually, t-values are an extension of z-scores. In a way, the t-value represents how many standard units the means of the two groups are apart.
With a t test, the researcher wants to state with some degree of confidence that the obtained difference between the means of the sample groups is too great to be a chance event and that some difference also exists in the population from which the sample was drawn. In other words, the difference that we might find between the boys’ and girls’ reading achievement in our sample might have occurred by chance, or it might exist in the population. If our t test produces a t-value that results in a probability of .01, we say that the likelihood of getting the difference we found by chance would be 1 in a 100 times. We could say that it is unlikely that our results occurred by chance and the difference we found in the sample probably exists in the populations from which it was drawn.
Five factors contribute to whether the difference between two groups’ means can be considered significant:
- How large is the difference between the means of the two groups? Other factors being equal, the greater the difference between the two means, the greater the likelihood that a statistically significant mean difference exists. If the means of the two groups are far apart, we can be fairly confident that there is a real difference between them.
- How much overlap is there between the groups? This is a function of the variation within the groups. Other factors being equal, the smaller the variances of the two groups under consideration, the greater the likelihood that a statistically significant mean difference exists. We can be more confident that two groups differ when the scores within each group are close together.
- How many subjects are in the two samples? The size of the sample is extremely important in determining the significance of the difference between means. With increased sample size, means tend to become more stable representations of group performance. If the difference we find remains constant as we collect more and more data, we become more confident that we can trust the difference we are finding.
- What alpha level is being used to test the mean difference (how confident do you want to be about your statement that there is a mean difference). A larger alpha level requires less difference between the means. It is much harder to find differences between groups when you are only willing to have your results occur by chance 1 out of a 100 times (p < .01) as compared to 5 out of 100 times (p < .05).
- Is a directional (one-tailed) or non-directional (two-tailed) hypothesis being tested? Other factors being equal, smaller mean differences result in statistical significance with a directional hypothesis. For our purposes we will use non-directional (two-tailed) hypotheses.
I have created an Excel spreadsheet that performs t-tests (with a PowerPoint presentation that explains how enter data and read it) and a PowerPoint presentation on t tests (you will probably find this useful).
Assumptions Underlying the t Test
- The samples have been randomly drawn from their respective populations
- The scores in the population are normally distributed
- The scores in the populations have the same variance (s1=s2) Note: We use a different calculation for the standard error if they are not.
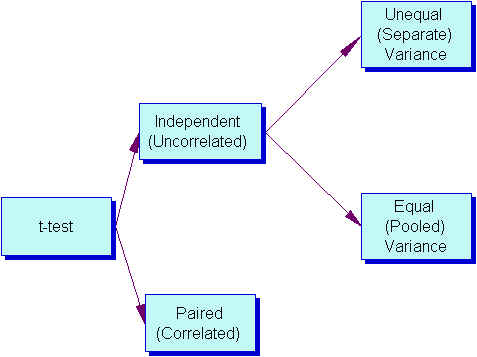
Three Types of t tests
- Pair-difference t test (a.k.a. t-test for dependent groups, correlated t test) df= n (number of pairs) -1
This is concerned with the difference between the average scores of a single sample of individuals who are assessed at two different times (such as before treatment and after treatment). It can also compare average scores of samples of individuals who are paired in some way (such as siblings, mothers, daughters, persons who are matched in terms of a particular characteristics).
- t test for Independent Samples (with two options)
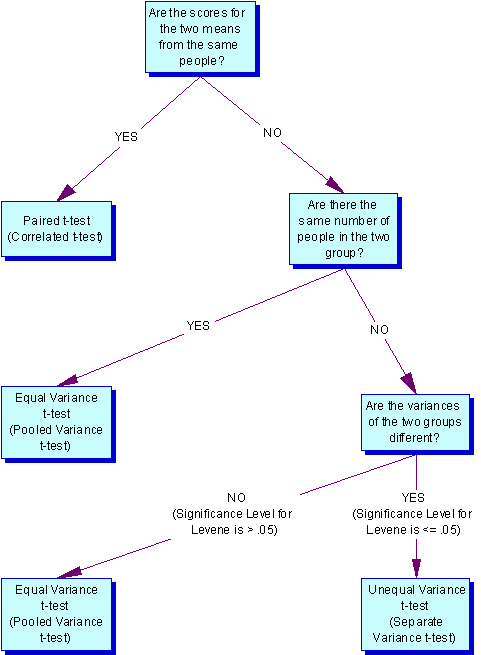
This is concerned with the difference between the averages of two populations. Basically, the procedure compares the averages of two samples that were selected independently of each other, and asks whether those sample averages differ enough to believe that the populations from which they were selected also have different averages. An example would be comparing math achievement scores of an experimental group with a control group.- Equal Variance (Pooled-variance t-test) df=n (total of both groups) -2 Note: Used when both samples have the same number of subject or when s1=s2 (Levene or F-max tests have p > .05).
- Unequal Variance (Separate-variance t test) df dependents on a formula, but a rough estimate is one less than the smallest group Note: Used when the samples have different numbers of subjects and they have different variances — s1<>s2 (Levene or F-max tests have p < .05).
How do I decide which type of t test to use?
Note: The F-Max test can be substituted for the Levene test. The t test Excel spreadsheet that I created for our class uses the F-Max.
Type I and II errors
- Type I error —
reject a null hypothesis that is really true (with tests of difference this means that you say there was a difference between the groups when there really was not a difference). The probability of making a Type I error is the alpha level you choose. If you set your probability (alpha level) at p < 05, then there is a 5% chance that you will make a Type I error. You can reduce the chance of making a Type I error by setting a smaller alpha level (p < .01). The problem with this is that as you lower the chance of making a Type I error, you increase the chance of making a Type II error. - Type II error —
fail to reject a null hypothesis that is false (with tests of differences this means that you say there was no difference between the groups when there really was one)
Hypotheses (some ideas…)
- Non directional (two-tailed)
Research Question: Is there a (statistically) significant difference between males and females with respect to math achievement?
H0: There is no (statistically) significant difference between males and females with respect to math achievement.
HA: There is a (statistically) significant difference between males and females with respect to math achievement. - Directional (one-tailed)
Research Question: Do males score significantly higher than females with respect to math achievement?
H0: Males do not score significantly higher than females with respect to math achievement.
HA: Males score significantly higher than females with respect to math achievement.The basic idea for calculating a t-test is to find the difference between the means of the two groups and divide it by the STANDARD ERROR (OF THE DIFFERENCE) — which is the standard deviation of the distribution of differences.Just for your information: A CONFIDENCE INTERVAL for a two-tailed t-test is calculated by multiplying the CRITICAL VALUE times the STANDARD ERROR and adding and subtracting that to and from the difference of the two means.EFFECT SIZE is used to calculate practical difference. If you have several thousand subjects, it is very easy to find a statistically significant difference. Whether that difference is practical or meaningful is another questions. This is where effect size becomes important. With studies involving group differences, effect size is the difference of the two means divided by the standard deviation of the control group (or the average standard deviation of both groups if you do not have a control group). Generally, effect size is only important if you have statistical significance. An effect size of .2 is considered small, .5 is considered medium, and .8 is considered large.
A bit of history…
William Sealy Gosset (1905) first published a t-test. He worked at the Guiness Brewery in Dublin and published under the name Student. The test was called Student Test (later shortened to t test).
t tests can be easily computed with the Excel or SPSS computer application. I have created an Excel Spreadsheet that does a very nice job of calculating t values and other pertinent information.

