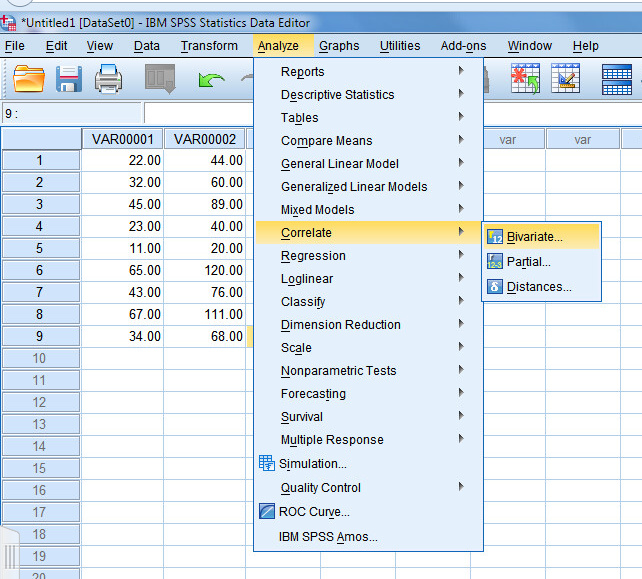
Enter pairs of scores in SPSS using the data editor. Enter each subject’s scores on a single row. If you only had two variable, enter one variable in the first column and the other variable in the second column. Once the data are entered, select Correlate from the Analyze tab and select Bivariate from the Correlate options.
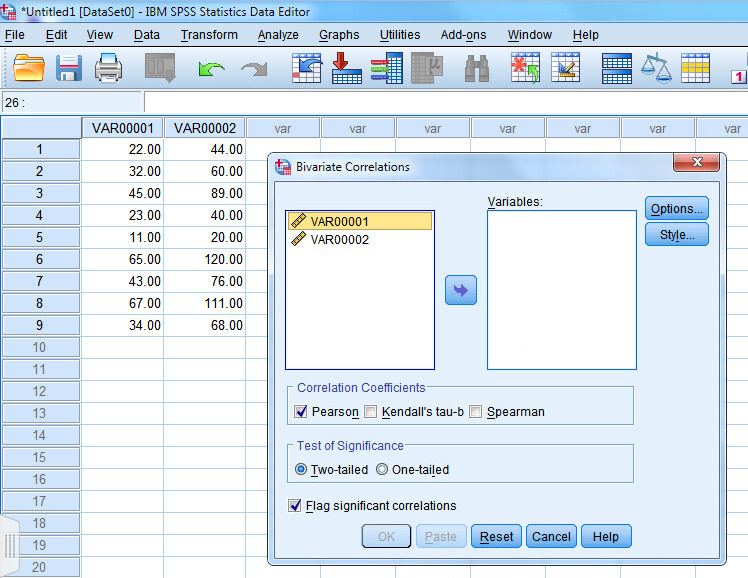
A dialog box will appear listing your variables. In this example, we have two variables. Most data files would contain a range of variables. Click on the first variable in the dialog box that you wish to include in your correlation analysis and press the –> to move it into the Variables box. You could also double click on the variable name to move it into the Variable box.
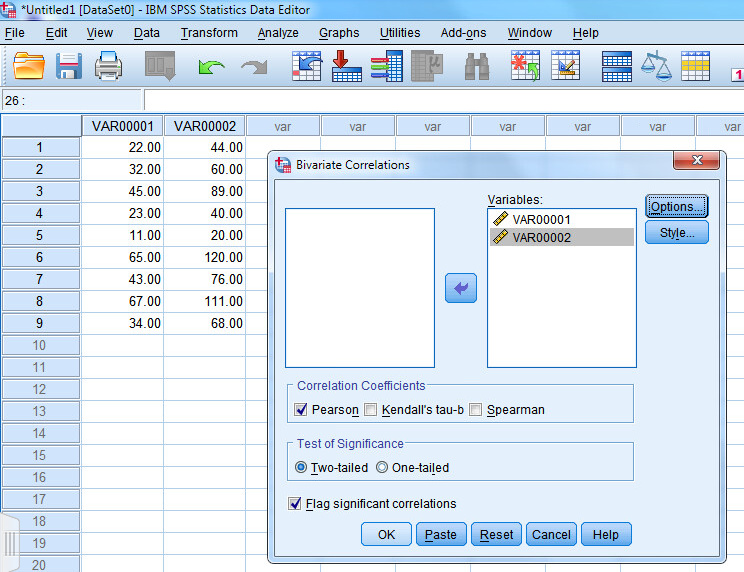
Once you have moved the two variables you wish to analyze to the Variables box, click on OK. By default, the system has selected Pearson and two-tailed significance.
Your output will appear in a separate window. The output shows Pearson’s correlation coefficient (r=.988), the two-tailed statistical significance (.000 — SPSS does not show values below .001. In actuality, there is always a chance of error, so you should report the value as p<.001 if SPSS reports .000), and the number of pairs (N=9).
![SPSS Correlation 4:Screen capture of an Excel spreadsheet with values in columns (VAR00001—A1 to A9) and (VAR00002—B1 to B9); showing Output1: [Document1] - IBM SPSS Statistics Viewer dialog box displaying Correlation results](https://researchbasics-education.media.uconn.edu/wp-content/uploads/sites/1215/2015/09/Fullscreen-capture-932015-125244-PM.bmp_.jpg)
Del Siegle, Ph.D.
Neag School of Education – University of Connecticut
del.siegle@uconn.edu
Updated 9/3/2015