Reliability (visit the concept map that shows the various types of reliability)
A test is reliable to the extent that whatever it measures, it measures it consistently. If I were to stand on a scale and the scale read 15 pounds, I might wonder. Suppose I were to step off the scale and stand on it again, and again it read 15 pounds. The scale is producing consistent results. From a research point of view, the scale seems to be reliable because whatever it is measuring, it is measuring it consistently. Whether those consistent results are valid is another question. However, an instrument cannot be valid if it is not reliable.
There are three major categories of reliability for most instruments: test-retest, equivalent form, and internal consistency. Each measures consistency a bit differently and a given instrument need not meet the requirements of each. Test-retest measures consistency from one time to the next. Equivalent-form measures consistency between two versions of an instrument. Internal-consistency measures consistency within the instrument (consistency among the questions). A fourth category (scorer agreement) is often used with performance and product assessments. Scorer agreement is consistency of rating a performance or product among different judges who are rating the performance or product. Generally speaking, the longer a test is, the more reliable it tends to be (up to a point). For research purposes, a minimum reliability of .70 is required for attitude instruments. Some researchers feel that it should be higher. A reliability of .70 indicates 70% consistency in the scores that are produced by the instrument. Many tests, such as achievement tests, strive for .90 or higher reliabilities.
Relationship of Test Forms and Testing Sessions Required for Reliability Procedures
| Testing Sessions Required |
Test Forms | Required |
| One | Two | |
| One | Split-Half Kuder-Richardson Cronbach’s Alpha |
Equivalent (Alternative)-Form |
| Two | Test-Retest | — |
Test-Retest Method (stability: measures error because of changes over time)
The same instrument is given twice to the same group of people. The reliability is the correlation between the scores on the two instruments. If the results are consistent over time, the scores should be similar. The trick with test-retest reliability is determining how long to wait between the two administrations. One should wait long enough so the subjects don’t remember how they responded the first time they completed the instrument, but not so long that their knowledge of the material being measured has changed. This may be a couple weeks to a couple months.
If one were investigating the reliability of a test measuring mathematics skills, it would not be wise to wait two months. The subjects probably would have gained additional mathematics skills during the two months and thus would have scored differently the second time they completed the test. We would not want their knowledge to have changed between the first and second testing.
Equivalent-Form (Parallel or Alternate-Form) Method (measures error because of differences in test forms)
Two different versions of the instrument are created. We assume both measure the same thing. The same subjects complete both instruments during the same time period. The scores on the two instruments are correlated to calculate the consistency between the two forms of the instrument.
Internal-Consistency Method (measures error because of idiosyncrasies of the test items)
Several internal-consistency methods exist. They have one thing in common. The subjects complete one instrument one time. For this reason, this is the easiest form of reliability to investigate. This method measures consistency within the instrument three different ways.
– Split-Half
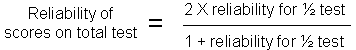
A total score for the odd number questions is correlated with a total score for the even number questions (although it might be the first half with the second half). This is often used with dichotomous variables that are scored 0 for incorrect and 1 for correct.The Spearman-Brown prophecy formula is applied to the correlation to determine the reliability.
– Kuder-Richardson Formula 20 (K-R 20) and Kuder-Richardson Formula 21 (K-R 21)
These are alternative formulas for calculating how consistent subject responses are among the questions on an instrument. Items on the instrument must be dichotomously scored (0 for incorrect and 1 for correct). All items are compared with each other, rather than half of the items with the other half of the items. It can be shown mathematically that the Kuder-Richardson reliability coefficient is actually the mean of all split-half coefficients (provided the Rulon formula is used) resulting from different splittings of a test. K-R 21 assumes that all of the questions are equally difficult. K-R 20 does not assume that. The formula for K-R 21 can be found on page 179.
– Cronbach’s Alpha
When the items on an instrument are not scored right versus wrong, Cronbach’s alpha is often used to measure the internal consistency. This is often the case with attitude instruments that use the Likert scale. A computer program such as SPSS is often used to calculate Cronbach’s alpha. Although Cronbach’s alpha is usually used for scores which fall along a continuum, it will produce the same results as KR-20 with dichotomous data (0 or 1).
I have created an Excel spreadsheet that will calculate Spearman-Brown, KR-20, KR-21, and Cronbach’s alpha. The spreadsheet will handle data for a maximum 1000 subjects with a maximum of 100 responses for each.
Scoring Agreement (measures error because of the scorer)
Performance and product assessments are often based on scores by individuals who are trained to evaluate the performance or product. The consistency between rating can be calculated in a variety of ways.
– Interrater Reliability
Two judges can evaluate a group of student products and the correlation between their ratings can be calculated (r=.90 is a common cutoff).
– Percentage Agreement
Two judges can evaluate a group of products and a percentage for the number of times they agree is calculated (80% is a common cutoff).
———
All scores contain error. The error is what lowers an instrument’s reliability.
Obtained Score = True Score + Error Score
———-
There could be a number of reasons why the reliability estimate for a measure is low. Four common sources of inconsistencies of test scores are listed below:
Test Taker — perhaps the subject is having a bad day
Test Itself — the questions on the instrument may be unclear
Testing Conditions — there may be distractions during the testing that detract the subject
Test Scoring — scores may be applying different standards when evaluating the subjects’ responses
———-
Del Siegle, Ph.D.
Neag School of Education – University of Connecticut
del.siegle@uconn.edu
www.delsiegle.info
Created 9/24/2002
Edited 10/17/2013