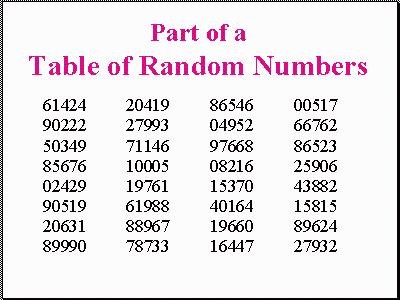
Many statistics and research books contain random number tables
similar to the sample shown below.
How to use a random number table.
- Let’s assume that we have a population of 185 students and each student has been assigned a number from 1 to 185. Suppose we wish to sample 5 students (although we would normally sample more, we will use 5 for this example).
- Since we have a population of 185 and 185 is a three digit number, we need to use the first three digits of the numbers listed on the chart.
- We close our eyes and randomly point to a spot on the chart. For this example, we will assume that we selected 20631 in the first column.
- We interpret that number as 206 (first three digits). Since we don’t have a member of our population with that number, we go down to the next number 899 (89990). Once again we don’t have someone with that number, so we continue at the top of the next column. As we work down the column, we find that the first number to match our population is 100 (actually 10005 on the chart). Student number 100 would be in our sample. Continuing down the chart, we see that the other four subjects in our sample would be students 049, 082, 153, and 164.
- Researchers use different techniques with these tables. Some researchers read across the table using given sets (in our examples three digit sets). For our class, we will use the technique I have described.
Microsoft Excel has a function to produce random numbers.
The function is simply
=RAND()
Type that into a cell and it will produce a random number in that cell. Copy the formula throughout a selection of cells and it will produce random numbers between 0 and 1.
If you would like to modify the formula, you can obtain whatever range you wish. For example.. if you wanted random numbers from 1 to 250, you could enter the following formula:
=INT(250*RAND())+1
The INT eliminates the digits after the decimal, the 250* creates the range to be covered, and the +1 sets the lowest number in the range.
